Analysis Context
Traffic in Luxembourg is an issue. It is a small country with a lot of cross-border traffic that can cause a lot of congestion. This analysis examines historical data from November to December 2024 about traffic in Luxembourg. It is focused on traffic flow, speed, congestion and travel time. With also some statistics about the number of incidents and the types of incidents. The data has been collected on the main Luxembourg highways (A1, A3, A4, A6, A7, A13, B40). The focus is to understand the profile of the traffic in Luxembourg and suggest some further analysis. The data has been collected from public APIs every 5 minutes.
Traffic Data Overview
Date range: 2024-11-12 18:29:00+01:00 to 2024-12-13 13:19:00+01:00
Number of measurements: 1,611,448
Number of unique sensor locations: 213
Number of unique highways: 7
Columns:
- timestamp
- publication_time
- site_id
- latitude
- longitude
- direction
- equipment_type
- speed_kmh
- occupancy_percent
- flow_rate_vph
- highway
- hour
- weekday
- congestion_index
Situations Overview
Number of situations: 8,634
Types of situations:
- VehicleObstruction: 5863
- Accident: 1766
- GeneralObstruction: 848
- AnimalPresenceObstruction: 61
- EnvironmentalObstruction: 44
- InfrastructureDamageObstruction: 38
- PoorEnvironmentConditions: 14
Columns:
- timestamp
- situation_id
- version
- version_time
- confidentiality
- information_status
- record_id
- record_version
- record_type
- creation_time
- probability
- validity_status
- start_time
- road_number
- from_distance
- to_distance
- carriageway
- affected_lanes
- maintenance_type
- accident_type
- latitude
- longitude
- alertc_direction
- alertc_primary_location
- alertc_primary_offset
- fault_type
- equipment_type
- construction_type
- obstruction_type
Traffic Time Overview
Number of unique routes: 31
Columns:
- timestamp
- location
- latitude
- longitude
- destination
- travel_time
- hour
- weekday
- route_id
- distance_km
- avg_speed
- peak_period
Sensor Network
Incident Overview
Incident Distribution
VehicleObstruction
Accident
GeneralObstruction
AnimalPresenceObstruction
EnvironmentalObstruction
InfrastructureDamageObstruction
PoorEnvironmentConditions
Traffic Analysis
We can clearly see the peaks in the morning and evening for inbound and outbound traffic for every highway. The difference of vph can be different for each highway, but the pattern is the same.
A bit in the other way than the flow rate, we can see that the speed is lower in the morning and evening peaks for inbound and outbound traffic respectively. But here we can see that the B40 is not really affected by peaks compared to the other highways. Eventhough we've seen that it has peaks in the flow rate. It is also important to note that the speed is limited at 90km/h during the morning peak on A6. Here, the most affected highways are A3 and A4.
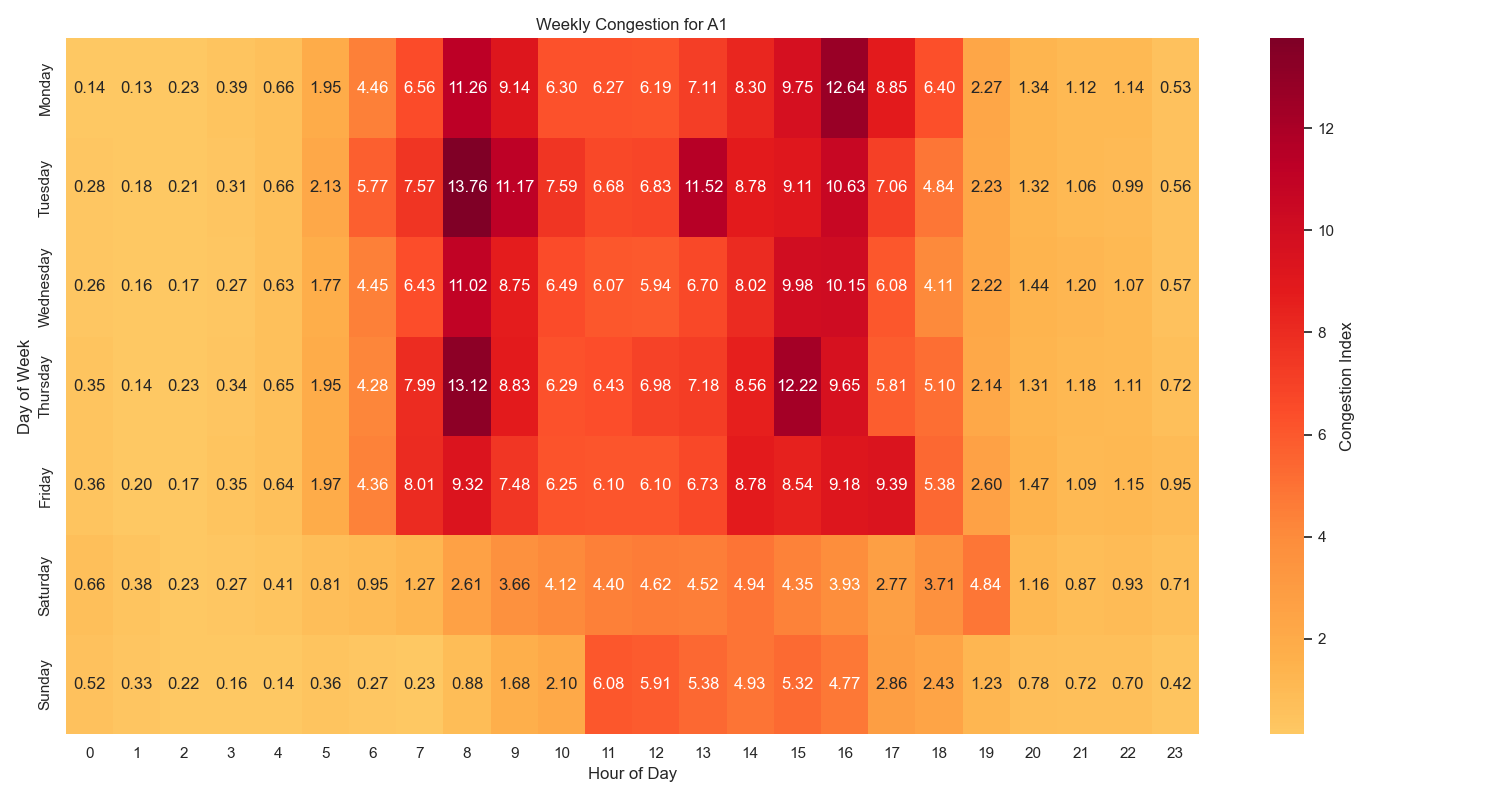
Here we can see the congestion heatmap for the different highways. We can still see the peak hours but the congestion index varies a lot between highways. We have for example higher index for A3 and A4 but for a shorter period. The A6 have lower index but for a longer period. It is also important to note that the A3 have lot more congestion in the morning than in the evening.
Here we can see the journey variability for the different highways. The graphs take the top 10 routes with the highest variability by percentage or minutes. The variability has been calculated by the standard deviation of the journey time and by taking the trip duration off peak as baseline and comparing with trip duration during peak hours. The bar represents the average trip duration outside of peak hours and the error bar represents the additional time added during peak hours.
Peak Hour Analysis
Morning Peak Analysis (Top 5 Busiest Segments):
| Highway | Direction | Hour | Weekday | Flow Rate (vph) |
|---|---|---|---|---|
| A6 | inboundTowardsTown | 7 | Friday | 2886 |
| A6 | inboundTowardsTown | 7 | Thursday | 2857 |
| A6 | inboundTowardsTown | 8 | Friday | 2847 |
| A6 | inboundTowardsTown | 7 | Wednesday | 2839 |
| A6 | inboundTowardsTown | 8 | Wednesday | 2768 |
Evening Peak Analysis (Top 5 Busiest Segments):
| Highway | Direction | Hour | Weekday | Flow Rate (vph) |
|---|---|---|---|---|
| A6 | outboundFromTown | 16 | Friday | 2978 |
| A6 | outboundFromTown | 16 | Wednesday | 2977 |
| A6 | outboundFromTown | 16 | Thursday | 2919 |
| A6 | outboundFromTown | 16 | Tuesday | 2891 |
| A4 | outboundFromTown | 15 | Wednesday | 2870 |
Key Findings
Peak Flow Rate
This peak flow rate of 4,941 vehicles/hour was recorded on the highway A4.
Average Speed
The average speed across all highways is a good indicator of the overall efficiency of highways. Speed tend to drop during peak hours, and goes back to normal after the peak hours. An average speed of 97.56 km/h show that traffic is quite affected by the peaks.
Busiest Highway
The busiest highway, identified as A4, experiences the highest average flow rate. This indicates that this is the highway to focus on for enhancing traffic flow.
Most Congested Highway
The most congested highway, identified as A6, experiences the highest average occupancy rate. This is also a point of improvement if the average speed tends to drop.